
Pulsar vs Kafka in K8s: Battle of Event Streams
2024-05-07
Pulsar vs Kafka
Tldr;
This tutorial walks you through deploying both Apache Pulsar and Apache Kafka on a local Kubernetes cluster using Kind, developing Go-based producers and consumers for each, performing load testing with Locust and k6 and monitoring performance using Prometheus and Grafana.
Prerequisites
- Docker
- Kind
- kubectl
- Helm
- Go
- k6
- Locust
Setting Up the Local Kubernetes Cluster with Kind
cat <<EOF | kind create cluster --name event-streams --config=- kind: Cluster apiVersion: kind.x-k8s.io/v1alpha4 nodes: - role: control-plane - role: worker - role: worker EOF
Verify the cluster is up and running:
kubectl cluster-info --context kind-event-streams
Deploy Apache Kafka (strimzi)
helm repo add strimzi https://helm-charts.strimzi.io helm repo update helm install strimzi-kafka-operator strimzi/strimzi-kafka-operator --namespace kafka --create-namespace kubectl get pods -n kafka
Deploy Apache Pulsar
helm repo add apache https://pulsar.apache.org/charts helm repo update # deploy pulsar kubectl create namespace pulsar helm install pulsar apache/pulsar --namespace pulsar --set initialize=true # verify pulsar is up and running kubectl get pods -n pulsar
Kafka Producer and Consumer
We'll use the Confluent Kafka Go client.
Producer
package main import ( "github.com/confluentinc/confluent-kafka-go/kafka" "log" ) func main() { p, err := kafka.NewProducer(&kafka.ConfigMap{"bootstrap.servers": "kafka.kafka.svc.cluster.local:9092"}) if err != nil { log.Fatal(err) } defer p.Close() for i := 0; i < 10; i++ { p.Produce(&kafka.Message{ TopicPartition: kafka.TopicPartition{Topic: &"test", Partition: kafka.PartitionAny}, Value: []byte("Hello Kafka"), }, nil) } }
Consumer
package main import ( "github.com/confluentinc/confluent-kafka-go/kafka" "log" ) func main() { c, err := kafka.NewConsumer(&kafka.ConfigMap{ "bootstrap.servers": "kafka.kafka.svc.cluster.local:9092", "group.id": "go-consumer", "auto.offset.reset": "earliest", }) if err != nil { log.Fatal(err) } defer c.Close() c.SubscribeTopics([]string{"test"}, nil) for { msg, err := c.ReadMessage(-1) if err == nil { log.Printf("Received message: %s\n", string(msg.Value)) } else { log.Printf("Consumer error: %v (%v)\n", err, msg) } } }
Pulsar Producer and Consumer
Producer:
package main import ( "context" "github.com/apache/pulsar-client-go/pulsar" "log" ) func main() { client, err := pulsar.NewClient(pulsar.ClientOptions{ URL: "pulsar://pulsar-broker.pulsar.svc.cluster.local:6650", }) if err != nil { log.Fatal(err) } defer client.Close() producer, err := client.CreateProducer(pulsar.ProducerOptions{ Topic: "test", }) if err != nil { log.Fatal(err) } defer producer.Close() if _, err := producer.Send(context.Background(), &pulsar.ProducerMessage{ Payload: []byte("Hello Pulsar"), }); err != nil { log.Fatal(err) } }
Consumer:
package main import ( "context" "github.com/apache/pulsar-client-go/pulsar" "log" ) func main() { client, err := pulsar.NewClient(pulsar.ClientOptions{ URL: "pulsar://pulsar-broker.pulsar.svc.cluster.local:6650", }) if err != nil { log.Fatal(err) } defer client.Close() consumer, err := client.Subscribe(pulsar.ConsumerOptions{ Topic: "test", SubscriptionName: "go-subscriber", Type: pulsar.Shared, }) if err != nil { log.Fatal(err) } defer consumer.Close() msg, err := consumer.Receive(context.Background()) if err != nil { log.Fatal(err) } log.Printf("Received message: %s", string(msg.Payload())) consumer.Ack(msg) }
Load Testing with Locust & k6
Locust:
pip3 install locust
Create a locustfile.py:
from locust import User, task, between
from kafka import KafkaProducer
class KafkaUser(User):
wait_time = between(1, 5)
def on_start(self):
self.producer = KafkaProducer(bootstrap_servers='kafka.kafka.svc.cluster.local:9092')
@task
def send_message(self):
self.producer.send('test', b'Hello Kafka')
locust -f locustfile.py Access the web UI at http://localhost:8089.
k6:
brew install k6
kafka_test.js:
import { check } from 'k6';
import { Kafka } from 'k6/x/kafka';
const kafka = new Kafka({
brokers: ['kafka.kafka.svc.cluster.local:9092'],
});
export default function () {
const producer = kafka.producer();
producer.produce({
topic: 'test',
messages: [{ value: 'Hello Kafka' }],
});
producer.disconnect();
}
k6 run kafka_test.js
Monitoring with Prometheus and Grafana
helm repo add prometheus-community https://prometheus-community.github.io/helm-charts helm repo add grafana https://grafana.github.io/helm-charts helm repo update kubectl create namespace monitoring helm install prometheus prometheus-community/prometheus --namespace monitoring helm install grafana grafana/grafana --namespace monitoring
Retrieve Grafana admin password:
kubectl get secret --namespace monitoring grafana -o jsonpath="{.data.admin-password}" | base64 --decode ; echo
Port-forward Grafana:
kubectl port-forward svc/grafana -n monitoring 3000:80
Access Grafana at http://localhost:3000.
Configure Dashboards TODO
- Kafka: Use JMX Exporter to expose Kafka metrics to Prometheus.
- Pulsar: Metrics are exposed at /metrics endpoint. Ensure Prometheus is scraping these endpoints.
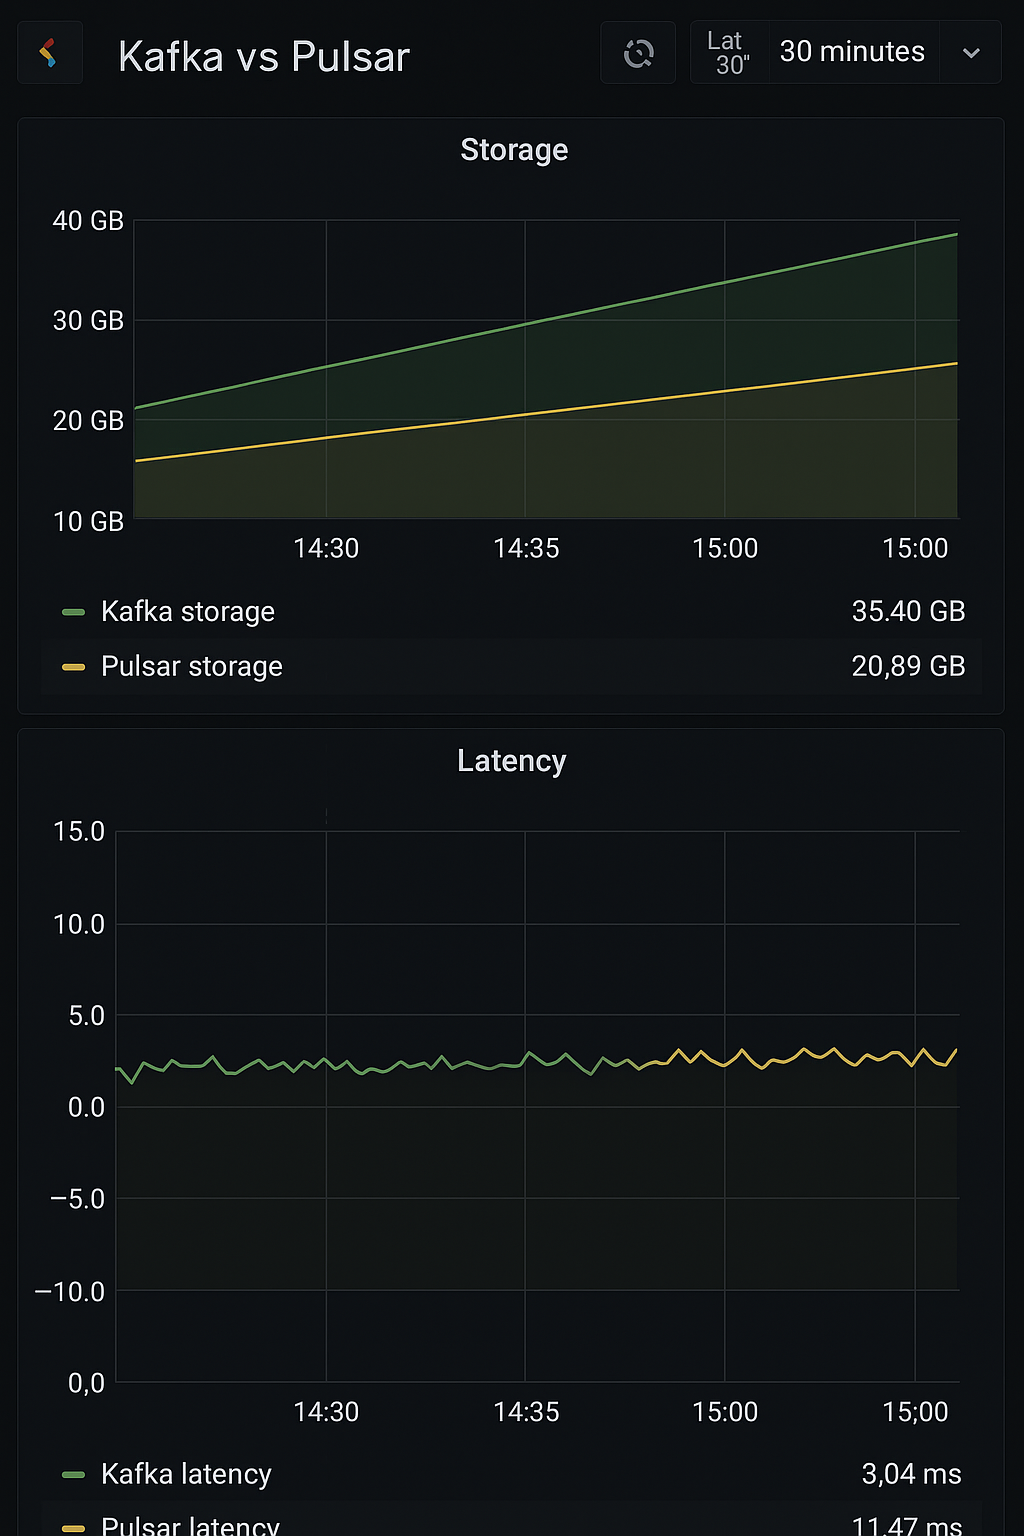
Import relevant dashboards into Grafana to visualize metrics like throughput, latency and resource usage.
Comparative Analysis TODO
After setting up both systems and running load tests:
- Throughput: Measure messages per second.
- Latency: Measure the time taken for messages to be processed.
- Resource Utilization: Monitor CPU and memory usage.
Use Grafana dashboards to compare these metrics side by side for Kafka and Pulsar under similar load conditions.