
Falco on K8s (Kind)
2024-04-02
Falco Kubernetes Lab: Runtime Threat Detection with Prometheus & Grafana
🧰 Prerequisites
- Docker
- Kind
- kubectl
- Helm
- Make
Setting Up the Lab
Clone the repo
git clone https://github.com/moabukar/falco-labs.git
cd falco-labs
Start the Lab
make up
This command executes the setup.sh up script, which performs the following:
- Creates a new Kind cluster with the configuration specified in kind.yaml. Called falco-lab.
- Creates the falco namespace and deploys a custom rules ConfigMap.
- Adds the Falco Helm repository and installs Falco with metrics enabled.
- Deploys an Nginx workload.
- Adds the Prometheus Community Helm repository and installs the kube-prometheus-stack.
- Creates ConfigMaps for the Falco dashboard and Grafana datasource.
- Upgrades the kube-prometheus-stack to load the dashboard and datasource.
- Port-forwards the Grafana service to localhost:3000.
- Waits for the Falco pods to be ready.
Setup/Bootsrap script
kind config
kind: Cluster
apiVersion: kind.x-k8s.io/v1alpha4
nodes:
- role: control-plane
  extraMounts:
    - hostPath: /dev
      containerPath: /dev
    - hostPath: /var/run/docker.sock
      containerPath: /var/run/docker.sock
  extraPortMappings:
    - containerPort: 6443
      hostPort: 60000
      listenAddress: "127.0.0.1"
      protocol: tcp
#!/bin/bash
set -e
function delete_existing_cluster() {
if kind get clusters | grep -q "^falco-lab$"; then
echo "[INFO] Cluster 'falco-lab' already exists. Deleting it..."
kind delete cluster --name falco-lab
fi
}
if [ "$1" == "up" ]; then
echo "[+] Creating kind cluster..."
delete_existing_cluster
kind create cluster --name falco-lab --config kind.yaml
echo "[+] Creating namespace 'falco' and deploying custom rules ConfigMap..."
kubectl create ns falco || true
kubectl create configmap falco-custom-rules \
--from-file=custom-rule.yaml=custom-rule.yaml \
-n falco || true
echo "[+] Adding Falco Helm repo..."
helm repo add falcosecurity https://falcosecurity.github.io/charts
helm repo update
echo "[+] Installing Falco (with metrics enabled)..."
helm install falco falcosecurity/falco \
--namespace falco \
-f values.yaml
echo "[+] Deploying nginx workload..."
kubectl create deployment nginx --image=nginx
echo "[+] Installing Prometheus & Grafana..."
helm repo add prometheus-community https://prometheus-community.github.io/helm-charts
helm repo update
helm install kube-prometheus-stack prometheus-community/kube-prometheus-stack \
--namespace monitoring --create-namespace
echo "[+] Waiting for Grafana pod to be Ready..."
kubectl wait --for=condition=Ready --timeout=180s pods -l app.kubernetes.io/name=grafana -n monitoring
echo "[+] Creating ConfigMap for Falco Dashboard..."
kubectl create configmap falco-dashboard \
--from-file=falco_dashboard.json=falco_dashboard.json \
-n monitoring || true
kubectl label configmap falco-dashboard -n monitoring grafana_dashboard=1 --overwrite
echo "[+] Creating ConfigMap for Grafana datasource..."
kubectl create configmap grafana-datasource \
--from-file=datasource.yaml=grafana_datasource.yaml \
-n monitoring || true
kubectl label configmap grafana-datasource -n monitoring grafana_datasource=1 --overwrite
echo "[+] Upgrading kube-prometheus-stack to load dashboard and datasource..."
helm upgrade kube-prometheus-stack prometheus-community/kube-prometheus-stack \
--namespace monitoring \
--reuse-values \
--set grafana.sidecar.dashboards.enabled=true \
--set grafana.sidecar.dashboards.label=grafana_dashboard \
--set grafana.dashboardsConfigMaps.falco-dashboard="falco-dashboard" \
--set grafana.sidecar.datasources.enabled=true \
--set grafana.sidecar.datasources.label=grafana_datasource
echo "[+] Forwarding Grafana service on port 3000..."
kubectl -n monitoring port-forward svc/kube-prometheus-stack-grafana 3000:80 &
echo "[+] Waiting for Falco pods to be Ready..."
kubectl wait --for=condition=Ready --timeout=180s pods -l app.kubernetes.io/name=falco -n falco
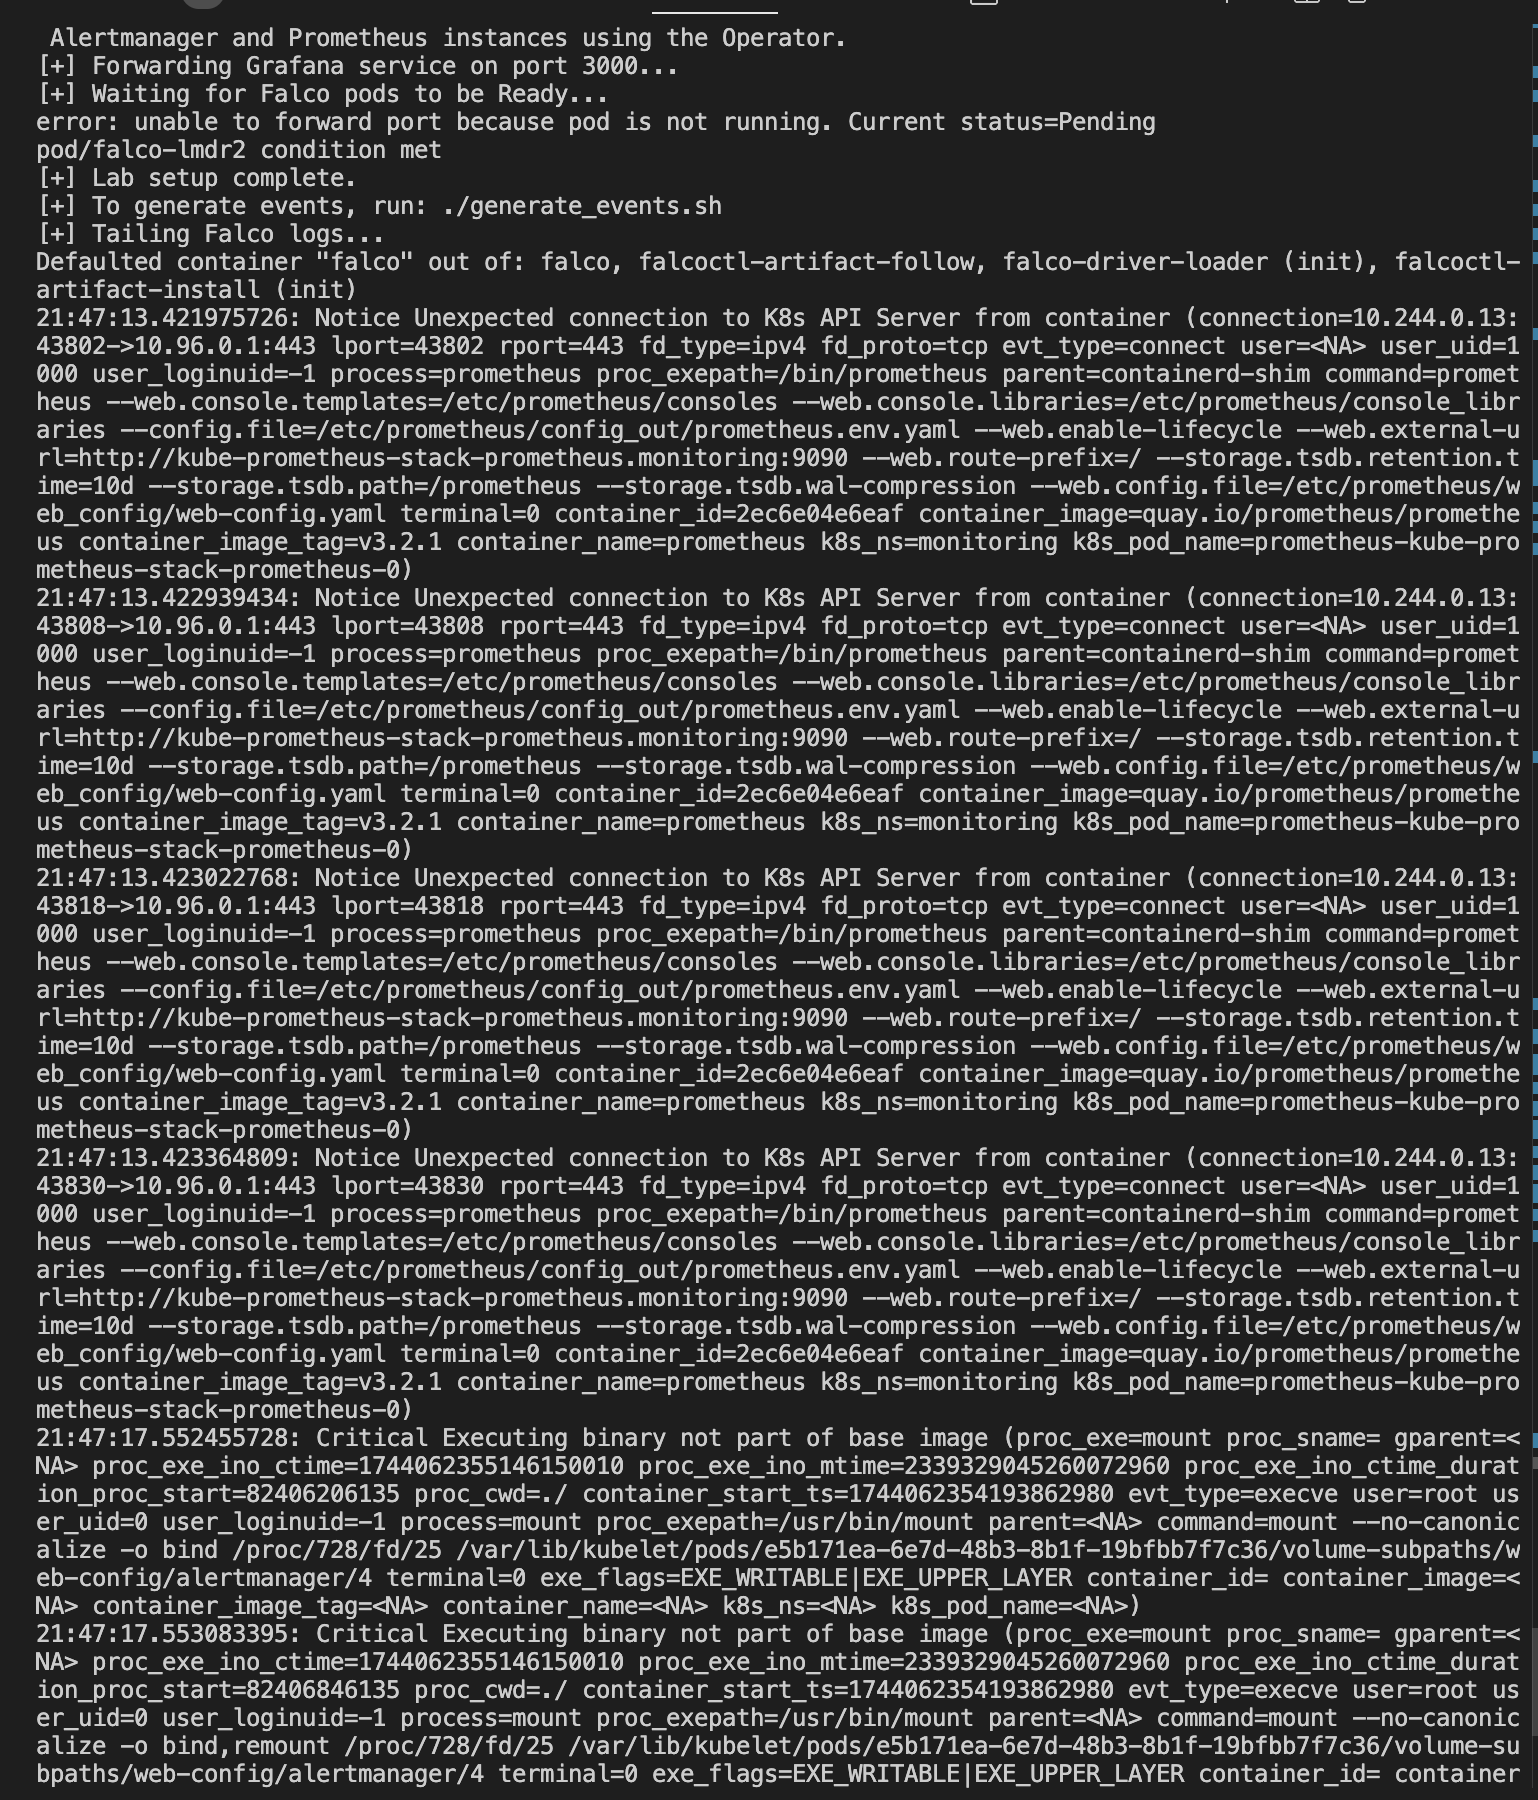
echo "[+] Lab setup complete."
echo "[+] Grafana is available at http://localhost:3000"
echo "[+] To get the Grafana admin password, run:"
echo " kubectl -n monitoring get secrets kube-prometheus-stack-grafana -o jsonpath=\"{.data.admin-password}\" | base64 -d ; echo"
echo "[+] To generate events, run: ./generate_events.sh"
echo "[+] Tailing Falco logs..."
kubectl logs -n falco -l app.kubernetes.io/name=falco -f
elif [ "$1" == "logs" ]; then
echo "[+] Tailing Falco logs..."
kubectl logs -n falco -l app.kubernetes.io/name=falco -f
elif [ "$1" == "down" ]; then
echo "[+] Uninstalling Falco..."
helm uninstall falco -n falco || true
echo "[+] Uninstalling Prometheus & Grafana..."
helm uninstall kube-prometheus-stack -n monitoring || true
echo "[+] Deleting all kind clusters..."
for cluster in $(kind get clusters); do
echo "[+] Deleting cluster: $cluster"
kind delete cluster --name "$cluster"
done
echo "[+] Cleanup complete."
else
echo "Usage: $0 {up|logs|down}"
exit 1
fi
# Manual test examples:
# kubectl run -it curl-test --image=alpine -- sh
# apk add curl
# curl http://example.com
🔍 Testing Falco Detection
Generate Events
#!/bin/bash
set -e

# Get the nginx pod name (assumes only one nginx pod)
POD=$(kubectl get pods -l app=nginx -o jsonpath='{.items[0].metadata.name}')

echo "[+] Generating event: reading /etc/shadow..."
kubectl exec -it "$POD" -- cat /etc/shadow || echo "[!] Failed to read /etc/shadow"

echo "[+] Generating event: writing to /etc/testfile..."
kubectl exec -it "$POD" -- sh -c "echo 'Falco Test' > /etc/testfile" || echo "[!] Write event failed"

echo "[+] Generating event: spawning a shell..."
kubectl exec -it "$POD" -- sh -c "sh -c 'echo Shell spawned'" || echo "[!] Shell spawn event failed"

echo "[+] Generating event: making a network connection (curl http://example.com)..."
kubectl exec -it "$POD" -- sh -c "apk add --no-cache curl && curl -s http://example.com" || echo "[!] Curl event failed"

echo "[+] Event generation complete."
./generate_events.sh
This script performs the following actions to trigger Falco rules:
- Reads the /etc/shadow file inside the Nginx pod.
- Writes to /etc/testfile inside the Nginx pod.
- Spawns a shell inside the Nginx pod.
- Makes a network connection using curl inside the Nginx pod.
Falco logs:
Create Falco Rules
here we have a custom rules file that we can use to test Falco.
Some rules like:
- Detecting curl in container
- Detecting shell in container
- Detecting write to /etc/sudoers
- Detecting write to /etc/shadow
- Shell spawned in container
- Privilege escalation via setuid binary
- Unexpected network connection from container
- rule: Detect curl in container
  desc: Someone ran curl inside a container
  condition: container and proc.name = "curl"
  output: "⚠️ curl detected: user=%user.name command=%proc.cmdline container=%container.id"
  priority: WARNING
  tags: [network, curl, suspicious]

- rule: "Read sensitive file /etc/shadow"
  desc: "Detect any read access to /etc/shadow"
  condition: "evt.type in (open, openat, openat2) and fd.name = /etc/shadow"
  output: "Sensitive file /etc/shadow read (command=%proc.cmdline user=%user.name)"
  priority: WARNING
  tags: [filesystem, sensitive]

- rule: "Write to /etc directory"
  desc: "Detect write operations to any file under /etc"
  condition: "evt.type in (open, openat, openat2) and evt.is_open_write=true and fd.name startswith /etc"
  output: "File in /etc written (command=%proc.cmdline user=%user.name)"
  priority: WARNING
  tags: [filesystem, custom]

- rule: "Write to /etc/sudoers"
  desc: "Detect any write to /etc/sudoers"
  condition: "evt.type in (open, openat, openat2) and evt.is_open_write=true and fd.name = /etc/sudoers"
  output: "Suspicious write to /etc/sudoers (command=%proc.cmdline user=%user.name)"
  priority: CRITICAL
  tags: [privilege_escalation, custom]

- rule: "Shell spawned in container"
  desc: "Detect any shell spawned in a container"
  condition: "proc.name in (sh, bash, zsh) and container.id != host"
  output: "Shell spawned in container (command=%proc.cmdline, container=%container.id)"
  priority: NOTICE
  tags: [container, runtime]

- rule: "Privilege escalation via setuid binary"
  desc: "Detect execution of setuid binaries (e.g., sudo, passwd) in a container"
  condition: "proc.name in (sudo, passwd) and evt.type = execve and container.id != host"
  output: "Setuid binary execution detected (command=%proc.cmdline user=%user.name)"
  priority: CRITICAL
  tags: [privilege_escalation, container]

- rule: shell_in_container
  desc: notice shell activity within a container
  condition: >
    evt.type = execve and
    evt.dir = < and
    container.id != host and
    (proc.name = bash or
     proc.name = ksh)
  output: >
    shell in a container
    (user=%user.name container_id=%container.id container_name=%container.name
    shell=%proc.name parent=%proc.pname cmdline=%proc.cmdline)
  priority: WARNING

- rule: "Unexpected network connection from container"
  desc: "Detect network connection attempts from container processes"
  condition: "evt.type = connect and container.id != host"
  output: "Network connection from container detected (command=%proc.cmdline, connection=%fd.name)"
  priority: NOTICE
  tags: [network, container]
View Falco Logs
make logs
This make alias tails the Falco logs, allowing you to observe the alerts generated by the events above.
📊 Accessing Prometheus & Grafana
kubectl -n monitoring port-forward svc/kube-prometheus-stack-prometheus 9090:9090
Prometheus
Access Prometheus at: http://localhost:9090
kubectl -n monitoring port-forward svc/kube-prometheus-stack-grafana 3000:80
Grafana
Access Grafana at: http://localhost:3000
Username: admin kubectl -n monitoring port-forward svc/kube-prometheus-stack-prometheus 9090:9090 Access Prometheus at: http://localhost:9090
kubectl -n monitoring port-forward svc/kube-prometheus-stack-grafana 3000:80
Access Grafana at: http://localhost:3000
Username: admin
Password: prom-operator
The Falco dashboard should be automatically loaded, displaying metrics and alerts.
Grafana Dashboard
{
    "annotations": {
      "list": []
    },
    "editable": true,
    "gnetId": null,
    "graphTooltip": 0,
    "id": null,
    "iteration": 1621469837171,
    "links": [],
    "panels": [
      {
        "datasource": "Prometheus",
        "fieldConfig": {
          "defaults": {},
          "overrides": []
        },
        "gridPos": {
          "h": 8,
          "w": 24,
          "x": 0,
          "y": 0
        },
        "id": 1,
        "options": {
          "legend": {
            "displayMode": "list",
            "placement": "bottom"
          },
          "tooltip": {
            "mode": "single"
          }
        },
        "targets": [
          {
            "expr": "sum(rate(falco_rules_alert_total[5m])) by (priority)",
            "interval": "",
            "legendFormat": "{{priority}}",
            "refId": "A"
          }
        ],
        "title": "Falco Alerts by Priority",
        "type": "timeseries"
      }
    ],
    "schemaVersion": 27,
    "style": "dark",
    "tags": ["falco"],
    "templating": {
      "list": []
    },
    "time": {
      "from": "now-1h",
      "to": "now"
    },
    "timepicker": {},
    "timezone": "",
    "title": "Falco Dashboard",
    "uid": "falco-dashboard"
  }
🧹 Tearing Down the Lab
make down
This command executes the setup.sh down script, which performs the following:
Uninstalls Falco and the kube-prometheus-stack.
Deletes all Kind clusters.
Conclusion
This lab provides a practical demonstration of integrating Falco into a Kubernetes environment for runtime security monitoring. By generating specific events, you can observe how Falco detects and alerts on suspicious activities, with Prometheus and Grafana providing visualization and analysis capabilities.